With 2017 now firmly in the rear-view mirror, I figured it was time to provide some commentary and concrete data on what ag land values did last year in the Southern Red River Valley of North Dakota and Minnesota. Many of you may have read recent articles in the Fargo Forum that provided some farmland values across ND (link here) and MN (link here). There is some good data and research here, but we are a bit biased to our own information! Here at Goldmark we also track ag land sales extremely closely and with great frequency. We work hard to eliminate transactions from our data that are not “arms length,” which means eliminating family deals or other transactions that had circumstances causing the price to be out of the market. This process gives us a very strong pulse on the market, and since we’ve been doing this for over 6 years now, we can easily identify trends and inform our clients about what is happening (or has happened) in the local land markets.
With all that said, here is Part 1 of our series on 2017 Ag Land values. In this post, we’ll start with some highlights for Cass County, North Dakota:
- Since 2012 (when we started tracking detailed ag land sales data), 2017 was the lowest volume year in terms of total acres sold and number of transactions in Cass County. This isn’t too shocking because when land markets see yearly declines in value (which we have seen since 2012/2013), less land tends to sell as owners hang tighter waiting for prices to rebound. Will 2018 see the market loosen up a bit? Many think so.
- So just how much did things tighten up? Well, when eliminating deals that were not “arms length”, we count 34 unique transactions in 2017 for a total 4,718 acres. This compares to 50 transactions and 8,022 acres sold in 2017. That’s a significant drop in the “supply” of acres sold on the market (which includes public and private sales). From 2013 to 2016, the average acres that sold per year (again, in arms length transactions) was around 8,250.
- Not all trends were negative however. The average price per acre in 2017 across those 34 deals was a 12% increase from 2016’s average. This too isn’t terribly shocking. Even with continued low commodity prices, demand for land (especially GOOD land) has remained relatively stable here in the Valley. When demand is constant but supply drops as it did last year, that tends to correlate to higher prices (Yes apparently I was paying attention in Economics 101!). Some 1031 money also helped drive prices up, which it tends to do. Is it possible we’ve come off the bottom of ag land values? I believe there is reason to think so.
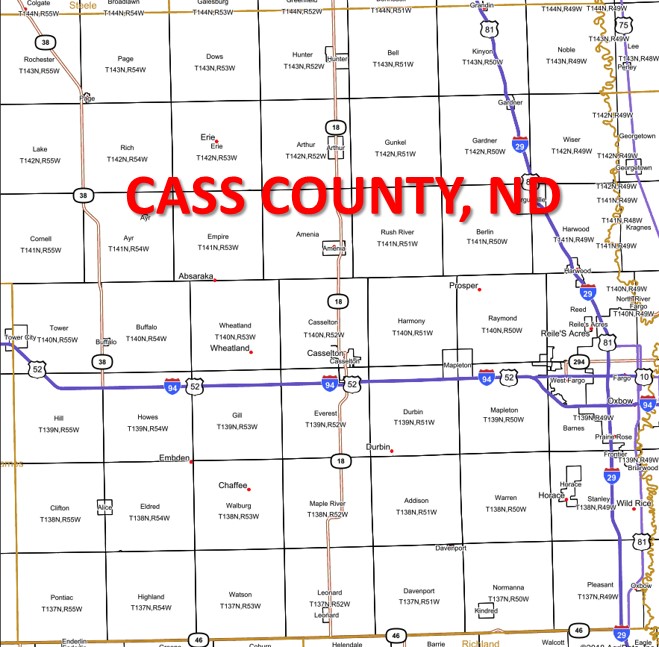
- Of course land in Cass County isn’t all the same, so when one looks at Red River Valley land (approx. the eastern 2/3 of the county) vs. the Drift Prairie dirt (approx. the western 1/3 of the county), there are some noticeable differences:
- Red River Valley land: 3,161 acres sold at an average of over $4,700/acre (which was a bit less acres sold than 2016 but at a higher price per acre)
- Drift Prairie land: 1,557 acres sold at an average of over $3,400/acre (which was WAY less acres sold than 2016, but again at a higher price per acre)
- Townships with the most land sales activity by total $ in 2017 were: Gardner, Addison, and Wiser
- Townships with the highest average price per acre values (having more than 1 sale) in 2017 were: Gardner, Maple River, and Addison
There is a LOT more information we have compiled than what you see above, so please contact us anytime if you want to dive into this information in more detail. Until next time!
Andy