Category

Ag Land Values

2019 Market Update

By Ag Land Values, General

We are overdue to give you a market update on land sales in the Southern Red River Valley, so here goes!

  • Value wise, we are seeing an increase in farm land values in 2019 compared to 2018, specifically on the ND side in Cass and Richland counties. Cass County especially has had a strong year in terms of price/acre results!
  • Volume of land sold so far is lower than in 2018, however there will be more land sales in Q4 of 2019 that may end up pushing us above the 2018 volume.
  • Overall we are seeing some better land being sold in 2019 compared to 2018. This is one reason we are seeing higher values overall, but demand in general has been strong as well.
  • There are more buyers than sellers in the farm land market right now, and we expect that trend to continue for awhile.

We’ll share some specific stats in early 2020 once all the 2019 sales have been recorded. Until then, if you want specifics or are curious about land values in your immediate area, please contact us any time and we would be happy to share.

Until next time!

Andy Westby

How can I find recent sale prices for farm land?

By Ag Land Values, General

As a Realtor & Auctioneer, I often get asked by friends and family how much a specific piece of land sold for recently. It’s human nature for people to be curious about area land prices, either because they maybe own similar land or want to buy land like it in the future, or perhaps they are just being nosy! Regardless, I think having current, accurate data about the market is important for many people. Here are a few ways you can research land prices if/when the need arises.

  • You can visit or call your county recorder’s office and ask for a list of recent ag land transactions or deeds to review. In North Dakota for example, most recorded deeds in the county will likely include the sale price right on them, unless they are between family members or title is exchanged via a Quit Claim deed (prices are exempted on those).  Some counties maintain a monthly or yearly spreadsheet of ag land sales that they may provide to you for free or for a small fee (Clay County, MN has one for $20 for example where Cass County, ND will send you one for free).
  • In North Dakota, you can subscribe to a service called NDRIN (North Dakota recorder’s information network @ http://ndrin.com/). This website aggregates digital copies of ALL recorded documents across the state so you can search by things like Grantor (seller), Grantee (buyer), or even section-township-range. It costs money each month to subscribe but for people who need regular access to sales data it is a great tool. Minnesota has an online tool as well at https://www.mndor.state.mn.us/ecrv_search/app/openCustomSearch to research sales history but I haven’t found it as current or helpful as NDRIN on the North Dakota side.
  • Call your local agent/auctioneer! Most people “in the business” should be up to speed on the local market. If they really have it together they can provide you with a wealth of recent transactions, even the ones they weren’t a part of. Worst case they may be willing to share details on the deals they were involved in, since once they have been recorded they are a matter of public record usually anyways.

If you are curious about recent land prices in the Southern Red River Valley, do not hesitate to contact us as we have a wealth of sales data we would be happy to help share should it be helpful to you!

Until next time,

Andy Westby

YTD Sales in the Red River Valley

By Ag Land Values

It has been some time since we did a check-in on sales activity on the North Dakota side of the southern Red River Valley, and there are some interesting trends to discuss! As we detailed earlier this year, sales started out pretty strong in Cass County yet were more moderate in Richland County. Through 9 full months now, that trend has continued in Cass while Richland has now picked up steam to outpace last year’s numbers at this time. Let’s talk a few details…

In Cass County, we count 31 arms-length deals with an average price of over $4,150/acre county-wide. That compares to a year ago at this time where we had counted 23 deals at an average price of $4,190/acre. It appears the majority of these sales are some of the less productive ground however, which generally is going to be sold at a discount to the best of the best soils. Sales for the higher productivity land have averaged over $4,800/acre YTD for example, with highs in the mid-$5k’s/tillable acre.

Richland County started quite slow but has had a much busier summer and fall, with 19 arms-length deals being recorded by our count from January through September. The average price has been around $3,600/acre which is in line with where it was at this point last year. Here again, we are seeing some of the less productive land trading which will limit the upside on pricing.

These numbers seem to indicate strong, consistent demand with largely neutral prices compared to last year. Keep in mind we saw rising prices last year so it’s great to see things not decrease given the tough time the Ag markets and operators are having this year (this blog post analyzed 2017 in Cass County for example). I expect to see a similar volume of ag land selling this fall as we saw last year…perhaps even a bit more depending on how yields and prices shake out the next couple of months.

If you want more details or to talk about buying or selling farm land in our area, feel free to contact us anytime!

Until next time,

Andy

What is a BPO?

By Ag Land Values, General

The question of “how much is my land worth” is common for landowners who may not be in touch with the current market activity or those who perhaps live out of state and therefore get out of touch with what’s going on locally. Nearly everyone is familiar with using an appraisal to get an independent, expert opinion on the value of a property. However, most people are NOT as familiar with another method commonly referred to as a BPO, or “Broker’s Price Opinion.”

BPO’s have been around for a long time and banks have routinely used them for different purposes depending on the project or loan size, but yet many landowners I talk with are not familiar with them or the benefits they offer. So let me explain what a BPO is in general terms:

  • A BPO is usually a formal report that any qualified real estate agent or broker can do for you.
  • A good ag land BPO should provide a description and overview of the subject property, with things such as soil maps, aerial maps, and “boots on the ground” pictures.
  • The BPO should also identify a number of recent sales in close proximity and/or in similar characteristic to the subject property.
  • Based on these recent sales and the author’s experience in the market, the report should give you a strong opinion on the value (or value range) of the subject property.
  • They are generally much shorter than a full appraisal, which means two important things: 1) they can be completed within 1-2 weeks typically, and B) they are much less costly than a full appraisal.

BPO’s have been used in the past to help buyer’s and seller’s arrive at a fair price, to help families make an informed decision if now is a good time to sell or to hold, to help establish a basis for inheritance purposes, and much more. If you are interested in learning more about this or want a BPO done for your land in the Southern Red River Valley, please do not hesitate to contact us!

Until next time!

Andy


How Farmer’s Can Pencil High Priced Land

By Ag Land Values, General

In the past couple of years, it has been a question I have heard routinely from people not connected directly to Ag but who are familiar enough with what has happened in the farm economy the last few years. The question goes something like this: How in the WORLD are farmer’s still paying that kind of money for farmland! I always enjoy this question as it’s a great opportunity to educate people and dispel some myths about ag land and the farm economy. Well the good people over at www.agriculture.com recently posted a new article that tackles this same question. Have a read yourself here: https://www.agriculture.com/farm-management/farm-land/how-are-farmers-affording-high-land-prices

While this area of the Southern Red River Valley doesn’t see the same prices mentioned in the article from places like Iowa, we still see strong prices for good land that make some people scratch their head. To summarize the article, here are the key reasons we continue to see good prices for strong farm land:

  1. For many, buying farmland is hard to pencil they day you buy it, but buyers are typically buying it for multiple generations. Over time, land investments have usually paid off and been a huge source of a farmer’s net-worth and future income when the time comes to stop farming it and start renting it.
  2. Farmers can often-times dollar-cost-average their investment in new land. Many farmers have owned land that was purchased decades ago for a few hundred dollars an acre. Paying a strong price today is easier when you can dollar-cost-average your total land investments across low-basis land with higher-value land.
  3. We are seeing more investors interested in ag land with prices having fallen since the highs of 2012/2013. Investors can tend to push the market a bit which can lead to rising prices.
  4. I will add one more item the article didn’t address. While the farm economy has struggled along the past few years, the top 20% of producers out there are still incredibly well positioned to capitalize on the land market when the right parcels come up for sale. Strong land will always bring strong prices, and there are still excellent operators out there with dry powder just waiting for the right opportunities.

Until next time!

Andy

Recent 2018 Sales in the Red River Valley

By Ag Land Values

Just a quick update on some of the recent activity here on the North Dakota side of the southern Red River Valley! January and February had quite a bit more sales volume in Cass County this year compared to last. By our count, almost 2000 acres have already traded hands in “arms-length” deals so far in Cass. I’m not sure this pace of volume will continue, but it certainly bodes well for hungry land buyers that more land seems to be moving compared to last year.

In Cass County, just over a dozen sales (some with the same sellers doing multiple deals) have been recorded with an average price per acre of around $4,200/acre. That’s lower than the average we saw county-wide in 2017, but the quality of the land that sold in January and February was also a bit lower than average (more Drift Prairie dirt on the western edge). There have still been some strong sales in the bunch for the Red River Valley soils though, so it seems the market is still pretty strong.

Richland County on the other hand has been pretty slow overall to start the year compared to Cass, but that isn’t abnormal for Richland where the volume of sales generally isn’t as high. Just 2 arms-length deals by our count, with prices right above their recent average in terms of $/acre.

If you want more details or to talk about buying or selling farm land in our area, feel free to contact us anytime! Until next time,

Andy

What Drives Ag Land Values? Part 4

By Ag Land Values

There is a common saying in selling real estate (well, selling anything really) that goes something like this:

“Something is only worth what someone else is willing to pay for it at the time you wish to sell it.”

There is a lot of truth to that, but of course MANY factors will ultimately drive what that price will be that someone else is willing to pay. In this multi-part blog series, we’ll cover some of the largest drivers of ag land values. We’ll also provide some context to our local Southern Red River Valley land market and how it relates to these factors. Let’s continue!

Read Part 1: Soils
Read Part 2: Drainage
Read Part 3: Size & Shape

Part 4: Status of the Market

This one seems obvious but it is worth discussing. Like any market, the ag land market goes in swings. Land prices go up, and land prices go down.  The extent to which those swings occur can change gradually or quite rapidly. The changes in the market are generally driven by global (macro) and local (micro) forces. Some of these forces have a slower, lagging effect while others can lead to quicker turns in the land value market. It is important for sellers to understand what type of a market they are in when they are ready to sell, as it may have an impact in either how the land is sold or even in their decision to sell at all. First, let’s cover some of the primary macro and micro forces that impact ag land values:

GLOBAL/MACRO FORCES

  • Commodity prices: The price of the products we produce here in the Red River Valley of North Dakota and Minnesota can have a large impact on ag land prices. Commodity prices on their own have a HUGE number of factors that influence them of course, but it’s easy to understand why when times are good and prices are high, land values rise. When times are tougher, and there is no question that right now we are in one of those periods, land values will fall.
  • Interest rates: As rates go up (which is the recent trend), prices tend to go down because as the cost of capital to finance land increases, it becomes more expensive to buy land. To a smaller degree, it also causes investors to lose interest because higher interest rates tend to increase returns on other investments that make farm land less attractive to them.
  • National/Global Policy: Policy decisions or regulations at the national or even global stage can have impacts in agriculture that can lead to changes in ag land values. Global trade ties into this as well as the easier or harder it is to move product around the globe, you could see eventual changes to land values.
  • Demand & Consumption: If worldwide demand and consumption for the products we produce increases or decreases, those shifts will impact the entire ag sector. Naturally that will eventually have an impact on the value of the land raising those products.

LOCAL/MICRO FORCES:

  • Taxes: Are taxes for farm land high, are they low, are they increasing, or are they decreasing? Taxes can play a large part for some buyers in how much they will value the land (especially the investor buyer). For example, currently taxes on the Minnesota side of the Red River can be quite a bit higher than the North Dakota side. Investors may not be able to get a high enough rent to cover the difference in taxes, so they will likely value the Minnesota land lower than the same type of ground just across the river.
  • Weather/Water: If you are in an area with prolonged droughts or persistent flooding, the value of your land could be weighed down as a result. Weather can also be a MACRO force if there is widespread disasters in other countries or areas which may lead to crop shortages, although these isolated types of events do not have a big impact on farm land values.
  • Future development potential: Does your farm land sit in close proximity from a major city or growing community, and if so is the growth path headed your way? If so, your land value will be higher than farm land well outside the path of the city, sometimes by a factor of 2 to 5 times as much as traditional farm land.
  • Market Influencers: This one is a bit broad, but locally there are always some miscellaneous factors that can heavily influence the value of land. For example, there may be one or two VERY aggressive, well-heeled buyers in the local market trying to buy up land, and driving up prices. Or perhaps there is a buyer that others in the local market want to keep OUT so they will bid up land just to keep it out of their hands. Maybe your market has a higher than average number of investors or people with 1031 money, which puts more upward pressure on land prices as well.

Of course there are many other global and local factors that can impact the value of ag land, and some of them are changing rapidly. How quickly land values adjust to these influences can vary widely, but we know with time these forces and more will drive values higher or lower.

Commodity prices have been low for some time which has been a big reason for the decline in ag land values since their highs in 2012/2013. As farm land values have dropped, so too has the sales volume of land. It stands to reason that as land values go lower, owners tend to hang on longer hoping the prices rebound and they can capture a higher profit. While the supply of available farm land has been lower in recent years in the Red River Valley, demand still seems to be pretty strong which has helped prices from declining further it seems. In the local market TODAY, we see ag land values holding fairly steady and maybe even increasing in some areas, such as Cass County (read more about what land values did there in 2017).

Only time will tell if the current market forces will lead land higher or lower, but we still believe now is a good time for both buyers and sellers of farm land in the Valley. Feel free to contact us if you agree and could use some help!

Until next time,

Andy

Part 1: Soils
Part 2: Drainage
Part 3: Size & Shape

2017 Ag Land Values – Cass County

By Ag Land Values

With 2017 now firmly in the rear-view mirror, I figured it was time to provide some commentary and concrete data on what ag land values did last year in the Southern Red River Valley of North Dakota and Minnesota. Many of you may have read recent articles in the Fargo Forum that provided some farmland values across ND (link here) and MN (link here). There is some good data and research here, but we are a bit biased to our own information! Here at Goldmark we also track ag land sales extremely closely and with great frequency. We work hard to eliminate transactions from our data that are not “arms length,” which means eliminating family deals or other transactions that had circumstances causing the price to be out of the market. This process gives us a very strong pulse on the market, and since we’ve been doing this for over 6 years now, we can easily identify trends and inform our clients about what is happening (or has happened) in the local land markets.

With all that said, here is Part 1 of our series on 2017 Ag Land values. In this post, we’ll start with some highlights for Cass County, North Dakota:

  • Since 2012 (when we started tracking detailed ag land sales data), 2017 was the lowest volume year in terms of total acres sold and number of transactions in Cass County. This isn’t too shocking because when land markets see yearly declines in value (which we have seen since 2012/2013), less land tends to sell as owners hang tighter waiting for prices to rebound. Will 2018 see the market loosen up a bit? Many think so.
  • So just how much did things tighten up? Well, when eliminating deals that were not “arms length”, we count 34 unique transactions in 2017 for a total 4,718 acres. This compares to 50 transactions and 8,022 acres sold in 2017. That’s a significant drop in the “supply” of acres sold on the market (which includes public and private sales). From 2013 to 2016, the average acres that sold per year (again, in arms length transactions) was around 8,250.
  • Not all trends were negative however. The average price per acre in 2017 across those 34 deals was a 12% increase from 2016’s average. This too isn’t terribly shocking. Even with continued low commodity prices, demand for land (especially GOOD land) has remained relatively stable here in the Valley. When demand is constant but supply drops as it did last year, that tends to correlate to higher prices (Yes apparently I was paying attention in Economics 101!). Some 1031 money also helped drive prices up, which it tends to do. Is it possible we’ve come off the bottom of ag land values? I believe there is reason to think so.
  • Of course land in Cass County isn’t all the same, so when one looks at Red River Valley land (approx. the eastern 2/3 of the county) vs. the Drift Prairie dirt (approx. the western 1/3 of the county), there are some noticeable differences:
    • Red River Valley land: 3,161 acres sold at an average of over $4,700/acre (which was a bit less acres sold than 2016 but at a higher price per acre)
    • Drift Prairie land: 1,557 acres sold at an average of over $3,400/acre (which was WAY less acres sold than 2016, but again at a higher price per acre)
  • Townships with the most land sales activity by total $ in 2017 were: Gardner, Addison, and Wiser
  • Townships with the highest average price per acre values (having more than 1 sale) in 2017 were: Gardner, Maple River, and Addison

There is a LOT more information we have compiled than what you see above, so please contact us anytime if you want to dive into this information in more detail. Until next time!

Andy

What drives ag land values? Part 3

By Ag Land Values

There is a common saying in selling real estate (well, selling anything really) that goes something like this:

“Something is only worth what someone else is willing to pay for it at the time you wish to sell it.”

There is a lot of truth to that, but of course MANY factors will ultimately drive what that price will be that someone else is willing to pay. In this multi-part blog series, we’ll cover some of the largest drivers of ag land values. We’ll also provide some context to our local Southern Red River Valley land market and how it relates to these factors. Let’s continue!

Read Part 1: Soils
Read Part 2: Drainage

Part 3: Size & Shape

It is easy for people to understand that the LARGER a piece of farm land, the more money the seller will get as a whole. However, not everyone understands the inverse relationship that often exists with the size of the parcel compared to the dollars per acre received. In other words, the seller of a half section (320 acres) may not receive as much money PER ACRE as the seller of a 40 acre parcel would receive PER ACRE. The reason? The buyer pool for smaller farm land parcels is LARGER than the pool of buyers who can afford to buy or finance large parcels. Remember that ancient economics class you once took?! Well, higher competition (demand) usually equals a higher price per acre as a result.

This doesn’t mean an owner of multiple sections of land should split them all up into 40 acre tracts to achieve top dollar. It does however mean that sellers should consider having some flexibility in how land is divided or sold when multiple tracts or larger tracts are going to be offered for sale. If you have heard about “Multipar” or “Multi parcel” land sales lately, that’s because they are a growing trend to help offer Buyers a wider variety of options to buy land which in the end usually results in more money for the Seller. Every situation is different and should be evaluated on its own merits, so please do not hesitate to contact us if you would like some assistance in evaluating your options (even if your land isn’t in the Red River Valley we can still offer you some free advice!).

One other aspect related to “size” and how it can impact value is the shape of the parcel and the amount of tillable acres on it (how many acres can you plant and harvest crops in other words). In the Red River Valley of North Dakota and Minnesota, most parcels are “square, flat and black.” However, because of things like drainage (natural or man-made), wetlands, railroad tracks, creek beds, telephone poles, coulees, etc., some tracts have an inefficient shape and/or a much lower percentage of tillable acres than those without these issues (which are often referred to as “encumbrances”). Some ag land tracts can be less efficient or hard for farmers with their larger equipment. For example, irregular shaped parcels can lead to over/under application of seed/fertilizer/chemicals, more time to plant/till/harvest, etc. which have a dragging effect on income or yield potential. Sellers must remember that buyers will place their value (and offers) on the tillable acres because that is where they will get their income (either by farming those acres or renting them out), so this must be taken into account when thinking about the value of your land. If you aren’t sure how many tillable acres your parcel has or the shape of it, you can always call your local county’s FSA office and ask them for more details (read Part 2 for help on contacting your local FSA office). We can also help look much of this up as well if you want to contact us.

Remember, the size and shape of your land is just one of many factors that impact the value of farm land. Stay tuned for future articles in this blog series that will uncover more.

Until next time!

Andy

Part 1: Soils
Part 2: Drainage
Part 4: Status of the Market

What drives ag land values? Part 2

By Ag Land Values

There is a common saying in selling real estate (well, selling anything really) that goes something like this:

“Something is only worth what someone else is willing to pay for it at the time you wish to sell it.”

There is a lot of truth to that, but of course MANY factors will ultimately drive what that price will be that someone else is willing to pay. In this multi-part blog series, we’ll cover some of the largest drivers of ag land values. We’ll also provide some context to our local Southern Red River Valley land market and how it relates to these factors. Let’s continue!

Read Part 1: Soils

Part 2: Drainage

Another heavy-weight when it comes to factors impacting the value of farm land is how well or poorly a piece of land drains. Good drainage on farm land has huge benefits. Well drained soils a) can generally be worked and planted earlier in the spring, b) have higher seed germination, c) grow plants with a stronger root system which leads to better access to subsoil moisture and nutrients, and d) generally produce higher yields.

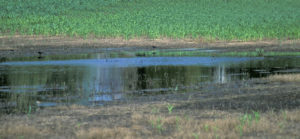
You may have the best soils around, but if the water backs up on your land or stays on the land too long, it will have a big impact on the value of it. If a piece of land has a lot of wetlands on it and/or is prone to flooding or drown out areas, this means the yield potential for the land will be diminished. Generally, the lower the yield potential the lower the value.

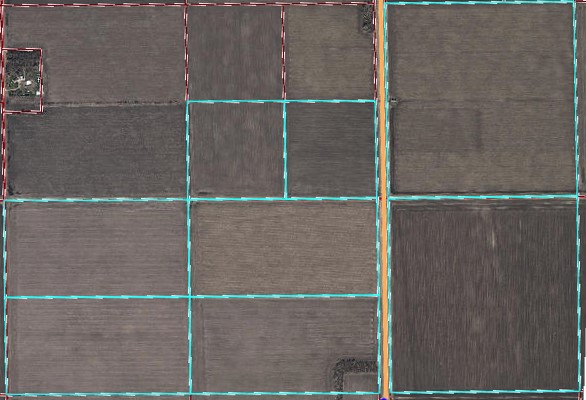
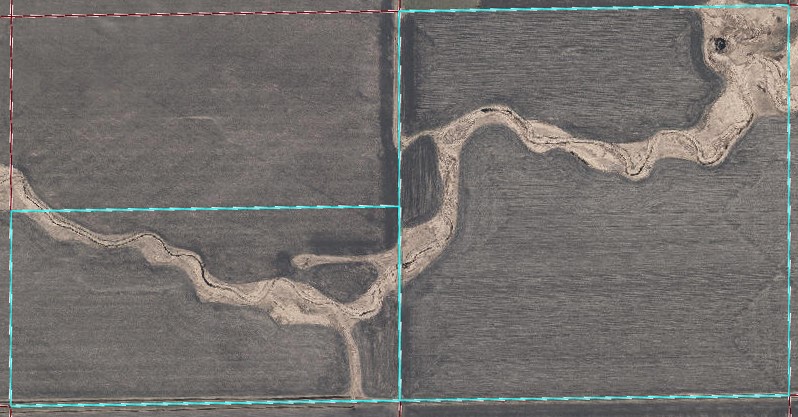
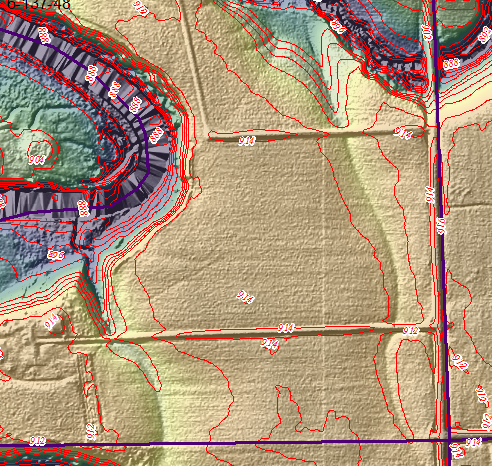
While most of the land in the Red River Valley is generally described as “flat, black, and square,” that doesn’t mean water drains the same across the entire valley. Many pieces of ag land in our area have some natural drainage features or impediments, such as natural undulation, elevations, roll or slope (however subtle they might be), small coulees, natural drains, and more. These natural features usually have either a positive or negative effect on drainage within a given piece of farm land. A great way to see the elevations and contours of land is through LiDAR images which show high and low points really well (example to the right). Contact us if you want a LiDAR image of your land. You can also contact your local FSA office (ND or MN) and ask for a wetland map of your land which would show likely problem areas.

Then there are man-made changes to drainage, all meant to improve drainage for the land. Two common in this area are surface ditching and drain tiling. Drain tile in this area is becoming more and more common as a way to improve drainage of land that otherwise may hold water longer than desired, or even to help reduce issues such as salinity in the soil. While drain tiling can come at a hefty expense (many ballpark the cost at around $1k/acre +/-), the benefits can also be significant.

Keep in mind, not ALL land is a good candidate for drain tiling. Depending on the soil types or other issues such as soil sodicity, you may not get the full benefits tiling can bring. Here is a good article put out by the NDSU Extension Service that may help you decide if your land is a good candidate or not.

If you farm your land, you already know if you have good drainage or not. If you do not farm it or perhaps live out of state and aren’t sure, you may be curious to know how good your drainage is. The easiest way to find out is to call your renter and ask for their feedback! If you want another opinion, you are always welcome to contact us as well and we would be happy to do some research for you.

Remember, drainage is just one of many factors that impact the value of farm land. Stay tuned for future articles in this blog series that will uncover more.

Until next time!

Andy

Part 1: Soils
Part 3: Size & Shape
Part 4: Status of the Market

X