There is a common saying in selling real estate (well, selling anything really) that goes something like this:
“Something is only worth what someone else is willing to pay for it at the time you wish to sell it.”
There is a lot of truth to that, but of course MANY factors will ultimately drive what that price will be that someone else is willing to pay. In this multi-part blog series, we’ll cover some of the largest drivers of ag land values. We’ll also provide some context to our local Southern Red River Valley land market and how it relates to these factors. Let’s get started!
This one should come as no surprise. If you have quality, highly productive soils, your land will be worth more than land with poorer, under-performing soils. If you farm the land yourself, you inherently know which land has high quality soils and which land does not. After all, the proof (i.e. yield) is often “in the pudding.” If you are not a farmer however, you may wonder how good is your soil? Well thankfully there are some objective ways this can be evaluated.
A bit of background first. There are a handful of major soil types in the world (sandy, silty, clay, peaty, loam, etc.) but among these there are THOUSANDS of soil series across the US alone (identified and labeled thanks to work done decades ago by the US Government’s soil surveys). In the southern Red River Valley of North Dakota and Minnesota, examples of local soil series includes the Fargo, Bearden, Kindred, or Tonka series (and a whole lot more). As you have likely heard before, the Red River Valley has some of the richest, most productive soils in the world. Yet variations in soil quality are very common here too.
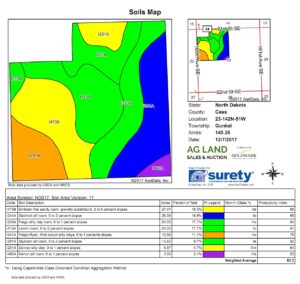
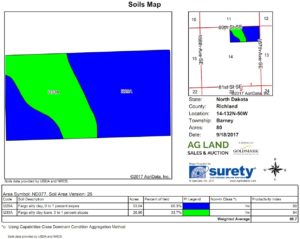
You see, under a series there are thousands of different Soil Map Units which include the specific variations/combinations of each series. Examples in our area of a Soil Map Unit include Fargo silty clay, Hamerly-Tonka complex, or Kindred-Bearden Silty Clay Loam just to name a few. Below are two soil maps for farmland in our area for example (one parcel with a very diverse soil mix and another with just a couple soil map units). Notice the wide differences you can see in complexity, diversity and more.
Each Soil Map Unit is assigned a relative quality index, commonly referred to as “Crop Productivity Index” or CPI. You will see that value in the last column in the soil maps above. These indexes can vary from region to region, so comparing these numbers for land in North Dakota versus Wisconsin for example would not be apples-to-apples necessarily. But for looking at soil quality within a given area, this CPI can be useful to gain a relative understanding of soil quality. Generally speaking, in our region a CPI in the 80’s or 90’s represents the strongest quality soils. A CPI in the 70’s or lower may indicate a lower producing piece of land. Take heed however…CPI is NOT the end-all/be-all of soil quality and it alone cannot be used as a measure to determine soil health, quality, and value. There are cases where land with a lower CPI has consistently out-yielded land with a higher CPI. It is however a good place to start when evaluating soil quality.
We won’t get any deeper than this, but it is safe to say that soil types and quality is very diverse across any geographic location and the southern Valley is no exception. And keep in mind, even within the same county (such as Cass County, ND), you can find vastly different soils on the eastern 2/3’s of the county (“Red River Valley” soil) compared to the western 1/3 (“Drift Prairie” dirt).
So how good is your soil? Well, the first step is to figure out what soils are on your land. One option is to pay for some of the online tools that make it very easy to look up this information (we use https://www.agridatainc.com/ for example). To look up this information for just a few pieces of land, it’s likely going to be cost prohibitive to do that however. A FREE option is to use online resource the USDA provides that allows you to look up any piece of land in the United States and get the soil survey information for it (https://websoilsurvey.nrcs.usda.gov/app/WebSoilSurvey.aspx). A bit harder to use, but you get what you pay for!
Once you know the soils you have, you can find a lot of information online about the different soil series and even individual Soil Map Units (such as https://soilseries.sc.egov.usda.gov/). You can also contact us at any point for help in quickly looking this information up for your land at no cost.
Land in the Red River Valley of North Dakota and Minnesota may also have soil issues such as high salinity or sodicity, which we haven’t covered here. And remember that information about soil types, map units, CPI, etc. is not bullet-proof and does not reflect things like soil health (a growing concern/focus among farmers and buyers) or other large drivers of ag land values (such as drainage, size, location, etc.). In future articles we’ll cover these other drivers and provide more insight into what ultimately drives the value of a piece of farmland.
Until next time!
Andy
Read Part 2: Drainage
Read Part 3: Size & Shape
Read Part 4: Status of the Market


